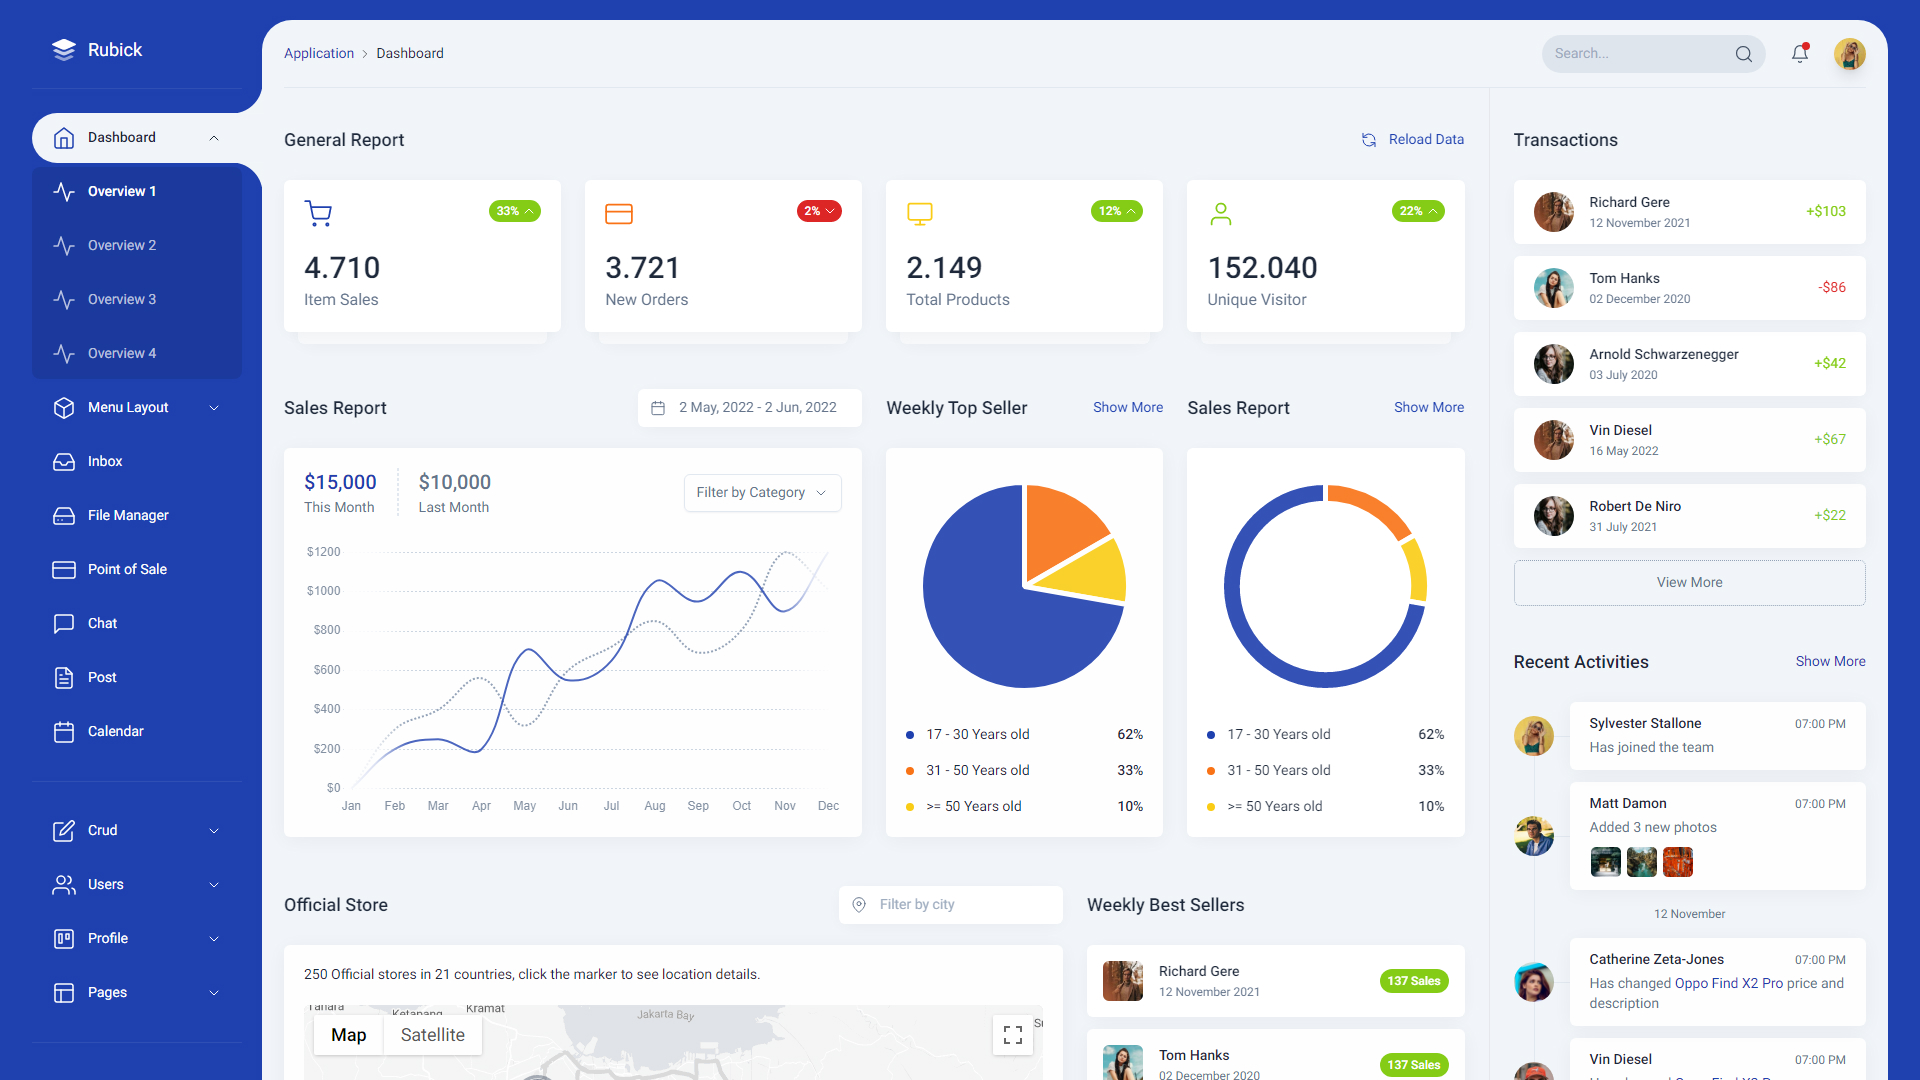
Business dashboards are visual tools that display key performance indicators (KPIs), metrics, and data in a consolidated and easy-to-read format. They help organizations monitor performance, track goals, and make data-driven decisions.
Key Features :
-
Visual Representations: Charts, graphs, gauges, and tables.
-
Real-Time Data: Many dashboards pull live data from multiple sources.
-
Customizable: Dashboards can be tailored to different departments or users.
-
Actionable Insights: Highlight trends, anomalies, and performance against targets.
Types of Dashboards:
-
Operational Dashboards
Monitor daily activities and operations (e.g., website traffic, sales orders, production output). -
Strategic Dashboards
Focus on long-term goals and overall company performance (e.g., market share, revenue growth). -
Analytical Dashboards
Provide detailed data analysis and trends for deeper insights (e.g., customer behavior analysis, financial forecasting).
Example Use Cases:
-
Sales Dashboard: Shows sales revenue, top-performing products, and sales by region.
-
Marketing Dashboard: Displays campaign performance, website traffic, and conversion rates.
-
Finance Dashboard: Tracks revenue, expenses, and profitability.
-
HR Dashboard: Monitors employee headcount, turnover rate, and satisfaction.
They’re like a control panel for your business, giving you a quick overview of how things are going and helping you spot opportunities or problems fast.